
Visualizing the improvement results by comparing measurement values before and after energy-saving measures.
Compare the measurement history before and after changing driving time and equipment settings in a graph. Organize the comparison conditions to utilize them for verifying improvement activities and sharing within the company.
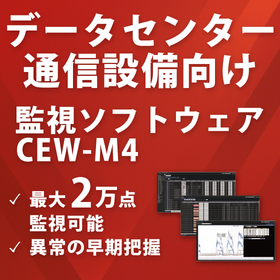
Even if changes are made to driving time, equipment settings, and stopping rules, managing the data separately before and after these changes can lead to time-consuming efforts to compare and share the results of improvement activities. "CEW-M4" saves data obtained from connected measuring devices as a history, allowing users to select the equipment, items, and periods they want to check and display them in graphs. The monitoring software "CEW-M4" aggregates data from connected devices onto a web interface, enabling list display, comparison, aggregation, history, CSV export, and alarm management. 【Challenges】 - I want to compare the history before and after operational changes on the same screen. - I want to share improvement results in graphs or CSV format. - I want to determine the next measures or expand the target. 【Effects of Implementation】 - Graphical comparison of history before and after operational changes. - Output and sharing of comparison results in CSV format. - Consideration of the next measures or target expansion. You can check detailed features and screen examples in the downloadable materials. For more information, please download the materials or feel free to contact us.
